Optimizing Wedding Reception Seating Charts
Recently my wife and I were married. We were so fortunate that many of our close friends and family members attended our wedding in California (we live in Texas). My beautiful wife was the ultimate planer and tackled almost every task of wedding planning with her mom. I definitely lucked out with my responsibilities being minimal. However, when she asked for my help with the seating chart of the 90 guests I knew this was a problem that data science could help solve. Luckily after reading Alogrithms to Live By, written by Christian and Griffiths, I came across Meghan Bellows story of planning her wedding while also doing her PhD research in chemical engineering. Using specific scores for each guest relationship and specifying a few constraints I was able to replicate a similar ‘travelling salesman problem’. Along the way I also found this github repo here by Megan Stiles. She tackled the optimization problem of seating her guests, so big shoutout to her for the R code help.
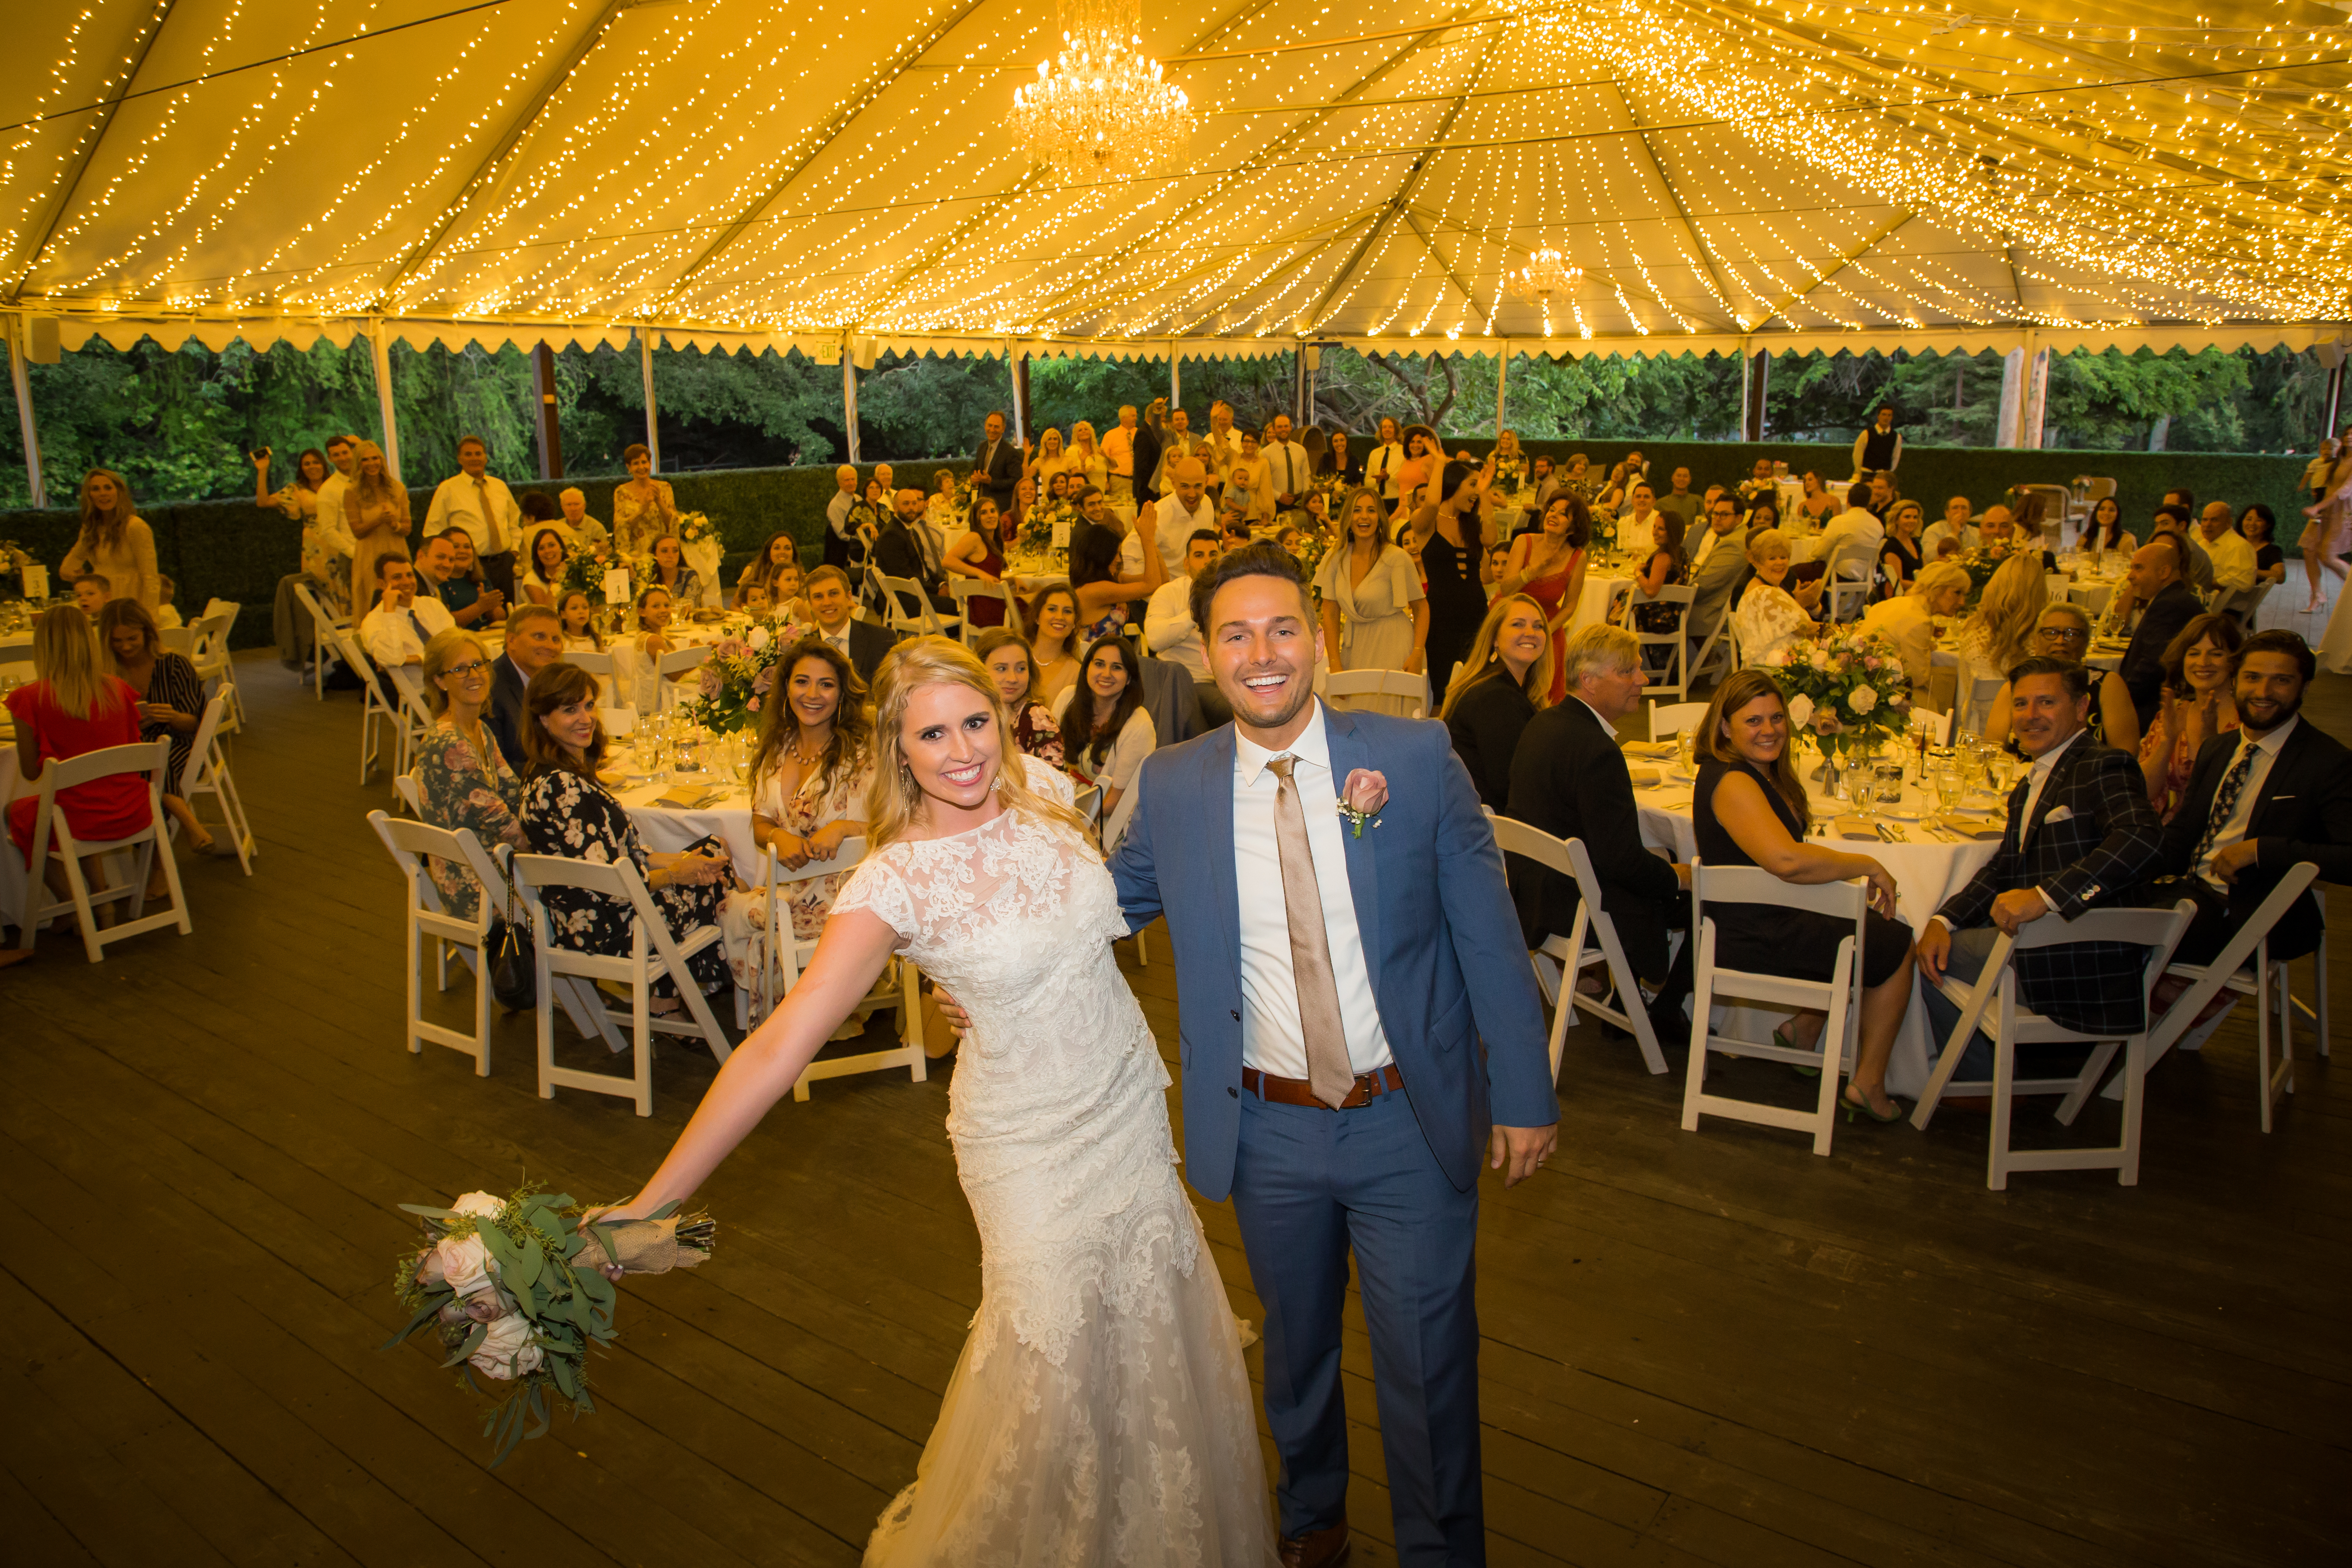 Figure 1. Final tables at the reception.
Based on the assumption that people want to sit at a table with the people they are most closely related we made our guest relational matrix of 90 guests for the Wedding Reception, 9 Tables of 10.
Key: 2000 = Spouse/Date, 900 = Sibling, 700 = Parent/Child, 600 = Grandparent, 500 = Cousin, 300 = Aunt/Niece, 100 = Friend, 0 = Strangers, 5000 = Bride/Groom
Unfortunately there were no other ways to tackle this problem then to manually enter the matrix data into excel, feel free to reach out if you can think of any better suggestions.
library(tidyverse)
library(genalg)

wedding_matrix <- read_csv("wedding_seating_chart.csv")
# 1s indicate the guest is at the current table and 0s indicate they are not. The model will seat one table at a time and iterate until all the tables are filled

### Define Fitness Function

evalFunc <- function(x) {
  # Total Table Closeness, initialize to 0
  closeness = 0

  # Number of people at the table
  current_table_1 = sum(x == 1)

  # Calculate Index of each person at the tablen (This corresponds to the closeness matrix)
  i = 0
  Table_1_POS<- vector()

  for (i in 1:(length(x - 1))) {
    if (x[i] == 1) {
      Table_1_POS<-append(Table_1_POS,i)
    }
  }
  i = 0

  #Calculates the closeness for the table

  Table_1 = 0
  i=0
  for (i in 1: length(x)) {
    if (x[i] == 1) {
      j =0
      for (j in 1: length(Table_1_POS - 1)) {
        Table_1 = Table_1 + wedding_matrix[i, Table_1_POS[[j]] + 1]
      }
    }
  }
  #Total Closeness
  closeness = Table_1

  #Restrict Number of guests at each table
  if (current_table_1 > 10)
    return(0) else return(-closeness)

}

### Iteratively Seat Tables###

#Initialze interations to 300
iters = 300
i = 0

#initialize chromosome size to 60
size = 90

#Initialze seating vector to store seating vector
Seating_Order <- vector()
for (i in 1:8) {

  #Increase Generations for final two tables
  if ( i > 8) {
    iters = 1000
  }

  #Run GA
  ga.model <- rbga.bin(size = size, popSize = 200, evalFunc = evalFunc, iters = iters, elitism = TRUE)

  #Best Solution
  solution <- ga.model$population[which.min(ga.model$evaluations),]

  # Print Which Table we are on, The closeness, and how many people are at each table to keep track
  print(i)
  print(sum(solution == 1))
  closeness <- min(ga.model$evaluations)
  print(closeness)

  #Append Seated Guests to Seating_Order Vector
  seated <- wedding_matrix[solution == 1,]
  Seating_Order <- append(Seating_Order, as.character(seated$X))


  #Remove seated guests from the df before rerunning the model for the next table
  seated.index = vector()

  for (j in 1:(length(solution))) {
    if (solution[j] == 1) {
      seated.index<- append(seated.index, j)
    }
  }
  wedding_matrix = wedding_matrix[-c(seated.index[[1]],seated.index[[2]], seated.index[[3]], seated.index[[4]], seated.index[[5]], seated.index[[6]], seated.index[[7]], seated.index[[8]], seated.index[[9]], seated.index[[10]]),
                        -c((seated.index[[1]]+1),(seated.index[[2]]+1), (seated.index[[3]]+1), (seated.index[[4]]+1), (seated.index[[5]]+1), (seated.index[[6]]+1), (seated.index[[7]]+1), (seated.index[[8]]+1), (seated.index[[9]]+1), (seated.index[[10]]+1))]

  #Reduce size of chromosome by 10 for next run
  size = size -10

}

#Separate Tables
One = Seating_Order[1:10]
Two = Seating_Order[11:20]
Three = Seating_Order[21:30]
Four = Seating_Order[31:40]
Five = Seating_Order[41:50]
Six = Seating_Order[51:60]
Seven = Seating_Order[61:70]
Eight = Seating_Order[71:80]
Nine = as.character(weddingd_matrix$X)
Combine tables into final dataframe
seating_chart <- as.data.frame(bind_rows(One, Two, Three, Four, Five, Six, Seven, Eight, Nine))

#Save Completed Seating Chart in csv
write_csv(seating_chart, "Wedding_Seating_Chart.csv")
The final seating chart solution had only a few minor tweaks made by my bride but saved me from the strenuous process of deciding where each individual should sit and I also found a way to include R. Also, the wedding was a blast!
 Figure 2. My Beautiful Wife and I